
Frontend Performance Meets Green Coding

Nick
May 27, 2026
We've talked about frontend optimization as a UX and SEO problem for years. But there's another angle we've mostly ignored: energy consumption. Every render cycle, every bundle download, every animation uses real electricity. When you're serving millions of users, these inefficiencies add up fast. The internet produces carbon emissions comparable to the global aviation industry, but we can't see the environmental cost of bloated JavaScript bundles the way we can see airplane exhaust trails. That invisibility makes the problem harder to address.
The Three Layers of Frontend Energy
Frontend energy consumption happens across three distinct layers, and each requires different optimization approaches.
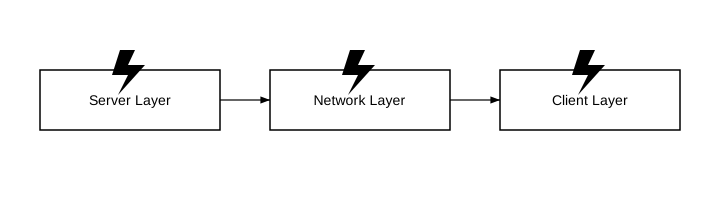
The Server Layer is where Next.js functions execute, where API routes process requests, and where server-side rendering happens. Every millisecond your serverless function runs, every database query that takes too long, every complex computation translates to watts consumed in data centers.
The Network Layer sits between servers and users. Researchers measure this using kilowatt-hours per gigabyte (kWh/GB) for data transferred over the internet, accounting for energy used by telecoms networks, CDN infrastructure, and transmission systems. More data transfer means more energy moving it across the globe.
The Client Layer gets overlooked: your users' devices. User devices account for about half of overall digital ecosystem emissions, yet we rarely think about the battery drain our code causes.
These layers matter because optimization strategies differ for each one of them. What saves server energy might increase network transfer. What reduces network usage might push more processing to the client. Green frontend development means finding the balance.
What We Can (and Can't) Measure
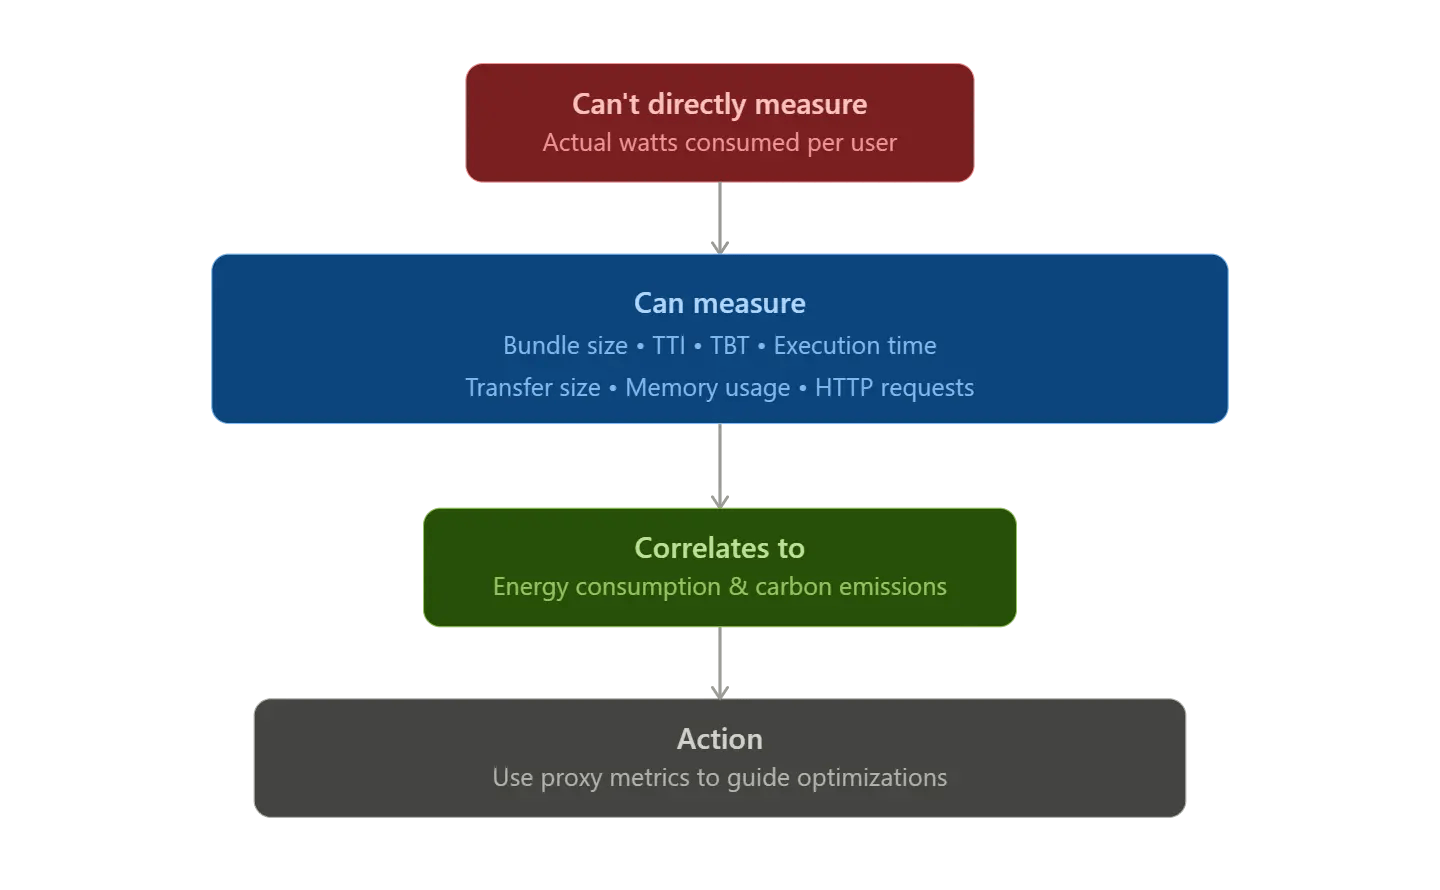
We can't directly measure frontend code energy consumption in production: we don't have wattmeters on every user's device. We rely on proxy metrics instead.
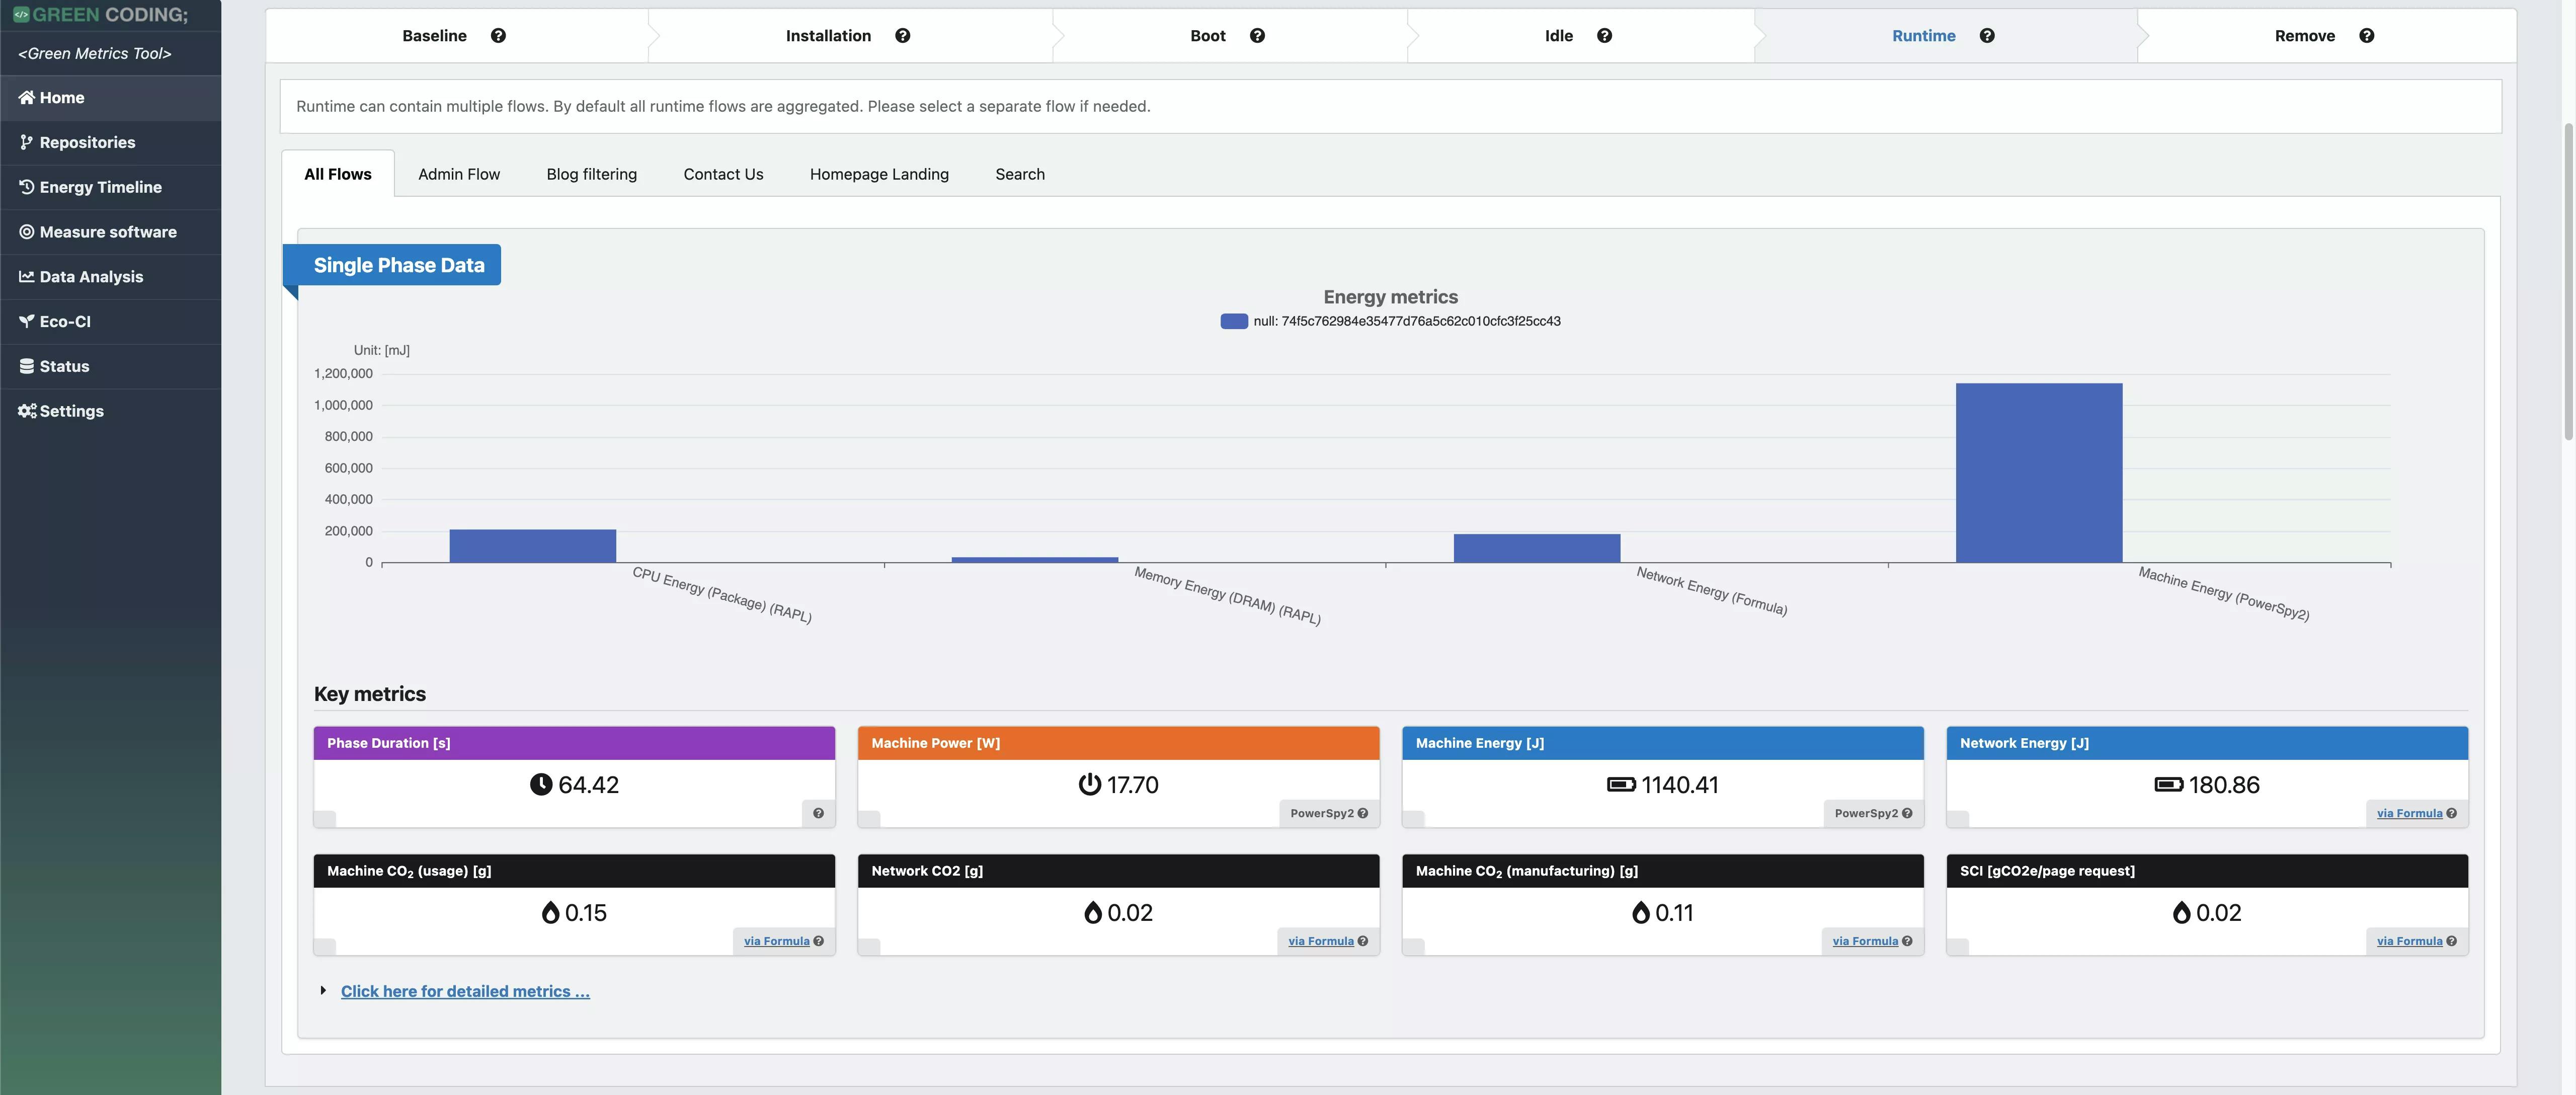
Server-side: We measure execution time and memory usage. Cloud providers offer cost metrics that correlate roughly with energy usage: longer execution times and higher memory allocation equal more energy consumed. For better data you can also use tools like the Green Metrics Tool that visualizes your own servers' energy consumption in self-hosted or controlled setups.
Network transfer offers clearer metrics. Bundle size, compressed transfer size, and HTTP request counts all correlate directly with energy consumption. More data transferred means more energy used across data centers, telecoms networks, and end-user devices.
Client-side measurement is hardest. We can't measure actual battery drain across devices, but Lighthouse metrics serve as proxies. Total Blocking Time correlates with CPU usage; Time to Interactive shows when pages become usable.
Optimization Strategies
Performance optimization and energy optimization are mostly the same work.
Network wins are easiest to grab. Keep pages reasonably small (for example under 300kb of script). The next/image component automatically optimizes images, serves modern formats like WebP, and implements lazy loading. Comparisons of PNG and WebP show WebP reduces file size by 25-35% without losses and up to 90% with minimal quality loss.
The most effective way to reduce network load is often avoiding large JavaScript frameworks or using them only where they provide clear value, since frameworks frequently account for the largest share of shipped code.
Client-side efficiency requires thinking about what runs and when. Here's a concrete example of lazy loading with React:
// Instead of importing everything upfront
import HeavyChart from './HeavyChart';
import DataGrid from './DataGrid';
import VideoPlayer from './VideoPlayer';

// Use dynamic imports to load components only when needed
const HeavyChart = React.lazy(() => import('./HeavyChart'));
const DataGrid = React.lazy(() => import('./DataGrid'));
const VideoPlayer = React.lazy(() => import('./VideoPlayer'));

function Dashboard() {
  const [showChart, setShowChart] = useState(false);

  return (
    <div>
      <button onClick={() => setShowChart(true)}>
        Load Analytics
      </button>

      <Suspense fallback={<div>Loading chart...</div>}>
        {showChart && <HeavyChart />}
      </Suspense>
    </div>
  );
}
This pattern defers loading the chart library until the user actually clicks to view it. For a component that's only viewed by 30% of users, you've just saved 70% of users from downloading that code.
Virtual scrolling only renders visible items in long lists. Lazy loading defers non-critical resources until they're needed.
Consider Dropbox's results: they reduced JavaScript bundle sizes by 33% and script count by 15% by replacing their legacy bundler with Rollup. Performance improvements were immediate and measurable. The energy savings are harder to quantify precisely, but undeniable when multiplied across millions of users.
Ready to start measuring? Here's a breakdown of key metrics across all three layers, what they tell you about energy consumption, and what you can do about them:
| Metric / Factor | Layer | How it relates to energy | Actionable tip |
|---|---|---|---|
| Initial JS bundle size | Network / Client | More bytes → more data transferred; heavier scripts → more CPU | Keep JS payload small; code-split and lazy-load |
| Image size & format | Network / Client | Larger images increase transfer energy; decoding consumes CPU | Use modern formats (WebP); lazy-load |
| Server function execution time | Server | Longer execution → likely higher energy in data centers | Optimize queries, caching, efficient algorithms |
| Memory usage / heap size | Server / Client | More memory = more energy for processing and storage | Avoid unnecessary in-memory structures |
| Time to Interactive (TTI) | Client | Longer TTI → device CPU works longer | Minimize main-thread blocking |
| Third-party scripts | Client / Network | Often large & poorly optimized → extra bytes & CPU load | Audit necessity; defer or async-load |
| CSS size & complexity | Client | Large CSS increases parsing & style calculation energy | Use critical CSS; remove unused styles |
| Video & autoplay media | Client / Network | Video streaming is energy-intensive | Use lazy-load; compress formats; avoid autoplay |
| Font files & web fonts | Network / Client | Large fonts → more data transfer & decoding | Subset fonts; preload only critical fonts |
| Caching effectiveness (CDN/browser) | Network / Server | Poor caching → repeated transfers → higher energy | Set cache headers; leverage service workers |
To sum up
Perfect measurement isn't the goal: improvement is. Start with what's visible and measurable: bundle size and Lighthouse scores.
Pick one metric this week and track it. Run Lighthouse on your main pages and note your Total Blocking Time. Check your largest bundles and question whether every dependency justifies its weight. The environmental impact of your code might be invisible, but your ability to improve it is tangible. Start measuring. Start optimizing. The planet and your users will benefit.
Some Tools to use
Chrome DevTools Coverage Tab: https://developer.chrome.com/docs/devtools/coverage webpack-bundle-analyzer: https://www.npmjs.com/package/webpack-bundle-analyzer Website Carbon Calculator: https://www.websitecarbon.com/ Green Metrics Tool: https://www.green-coding.io/products/green-metrics-tool/
Sources
- VWO - What You Can Do To Reduce the Carbon Footprint of Your Website
- DEV Community - What makes a website green? A guide for front end devs
- DebugBear - Why We Don't Report Website Carbon Emissions
- Sustainable Web Design - Estimating Digital Emissions
- Read the Tea Leaves - JavaScript performance beyond bundle size
- Calibre - Small Bundles, Fast Pages: What To Do With Too Much JavaScript
- Dropbox - How we reduced the size of our JavaScript bundles by 33%
Green Coding
Green IT
Carbon Footprint
Sustainability
Energy Tracking
Cloud Efficiency
Web Performance
Read also

Michael H., 09/22/2026
Vue 3.6: Vapor Mode Makes It the Fastest Vue Yet
Vapor Mode
Vue 3.6
Signals
Reactivity
Frontend Performance
Bundle Size

Irena, 03/11/2026
Robotics in Balance: How digital solutions make physical processes smarter
Industry 4.0
Digital process optimization
Data visualization
Modular robotics solutions
Automation
Predictive maintenance
Smart Factory Software

Philipp, 03/11/2026
From Excel chaos to competitive advantage: established processes as the perfect foundation for B2B portals
Digital Transformation
Process Automation
Data Management
Custom Software Development
Business Process Digitization